SCREENSHOTS
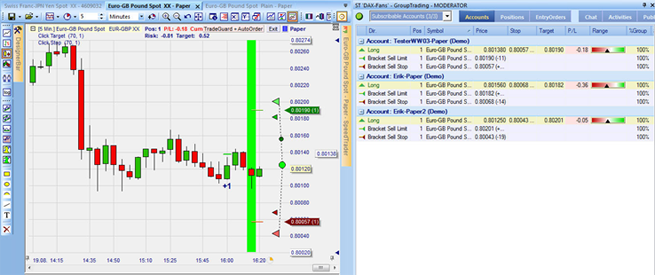
The positions and orders of other group members are visible in your chart.
This example shows a group of 3 traders. Each trader has a EUR/GBP position. Each trader protects his position with a stop loss and a target order. We see the screen of trader TesterWW03. The +1 and corresponding little green line indicate when and what price he opened his position. His two sell orders (stop loss and target) are the green and red pointy boxes. Notice he put his stop and between the targets and stops of the other 2 traders.
The positions and orders of the other 2 traders are also visible. The green dots indicate the price at which they opened their position. The green/red triangles indicate their orders. Click on a green dot. It increases in size. Dotted lines connect the position to the corresponding stop loss and target orders. A green background appears. The background indicates in which candle this position was opened. Tip: use the crosshairs in your chart to see easily see price levels.
The chat is very user-friendly.
It guarantees efficient conversation on any order or position. These traders are discussing their EUR/JPY positions. By clicking on the blue chat bubble the chat filter is activated. The precise topic “Long 5 Euro-JPN Yen ... (Demo)” appears in the filter window. Every group member knows precisely which position is being discussed.
If you only want to read and not chat, simply close the chat and move your mouse over the blue text bubble. This allows you to read all new and previous chats.
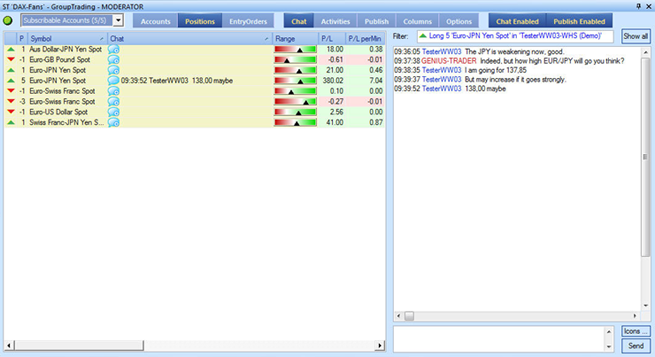
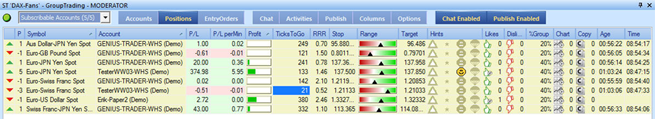
Fascinating real-time data and statistics are available.
A few examples ... you can see the return/risk ratio (RRR) for every position. P/L per Minute indicates positions whose profit (or loss) is increasing rapidly. These may offer opportunities. One trader uses a smiley to say to indicate he is happy with the way is position is evolving. The Range sliders give a nice overview of how all positions are evolving. Note: the P/L is in the currency of the instrument.
Much more data is available. By adding or removing columns you select the data you want to see.
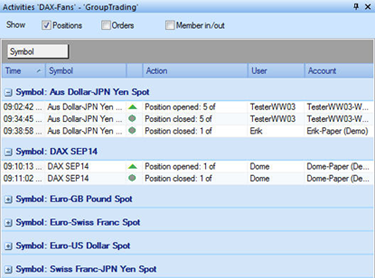
Activities is a history of what was traded in your group.
This allows you to get a good impression of where the action was before you logged into your group. The forex pair AUD/JPY, for example, was traded by 2 group members. One member opened and closed his position today (5 lots). The other closed a position which he had acquired prior to today (1 lot).
Tip: the activities screen can be sorted simply by dragging the column headers unto the grey area.